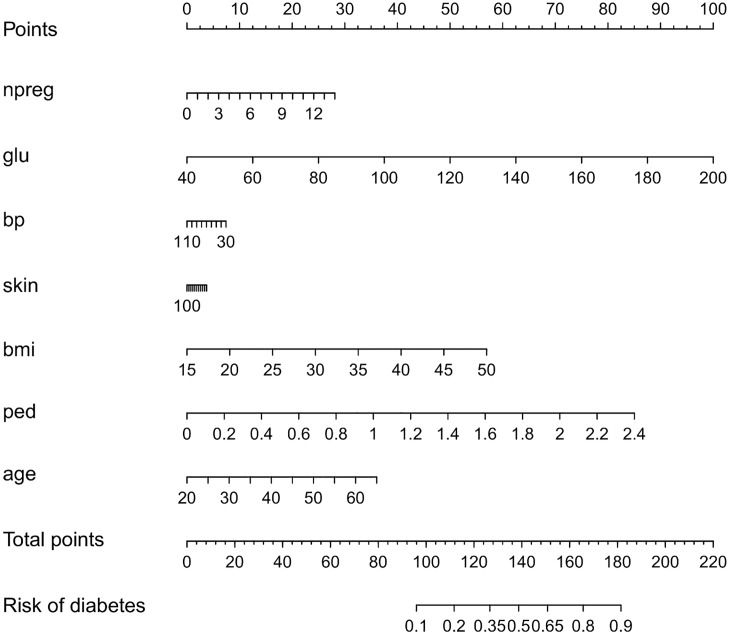
Fig 1. Visualization of the logistic regression model for the Pima dataset by means of a nomogram.
The contribution of each input variable x(p) (f(p) = w(p) x(p)) to the linear predictor is shifted and rescaled such that each contribution has a minimal value of zero and the maximal value of all contributions is 100. Each input variable is represented by means of a scale and the value of the contribution can be found by drawing a vertical line from the input variable value to the points scale on top of the plot. Adding the contributions of all input variables results in the total points. These can be transformed into a risk estimate by drawing a vertical line from the total points scale to the risk scale. The importance of the inputs is represented by means of the length of the scales: variables with longer scales have a larger impact on the risk prediction.

