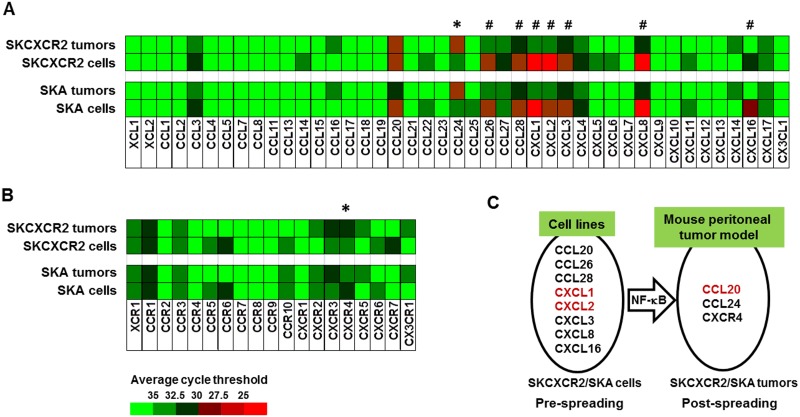
Fig 5. Shift of chemokine network in the tumor tissues of the omentum after implanted with parental cancer cells.
(A) Chemokine and (B) chemokine receptor network in the tumor tissues of the omentum implanted vs. SKA and SKCXCR2 cell line. Expression levels of chemokine network are the means of 4 tumor tissues and cell lines in duplicate, respectively. *,# indicate increased and decreased chemokines, respectively. (C) Proposed shift of dominant chemokines between pre-spreading and post-spreading of SKCXCR2 cells in the peritoneal cavity. Red letters indicate dominant chemokines in SKCXCR2 cells compared to SKA cells.

