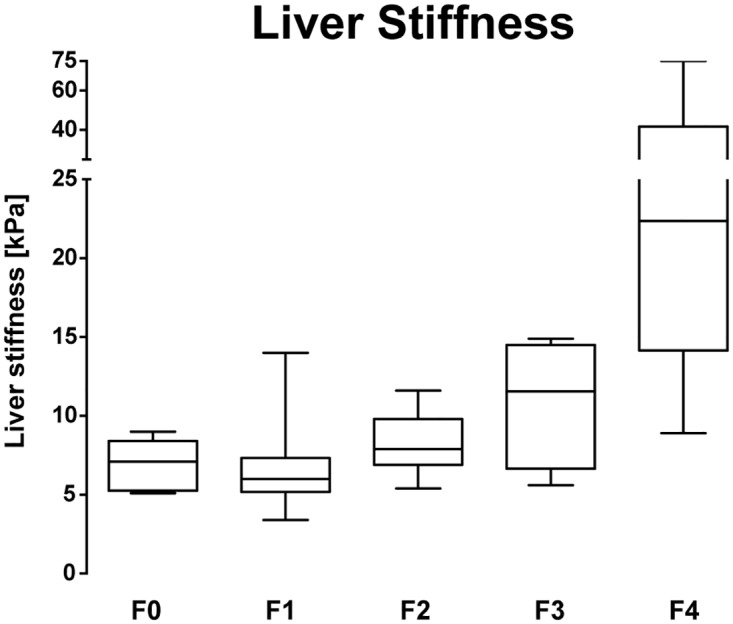
Fig 1. The Performance of TE Diagnosing Liver Fibrosis in PSC.

Box plot of TE measurement depending on histological fibrosis stage F0-F4 (n = 62). The bottom and top of the boxes represent the 25th and 75th percentile and the horizontal lines the median. The whiskers are the minimum and maximum of the data.
