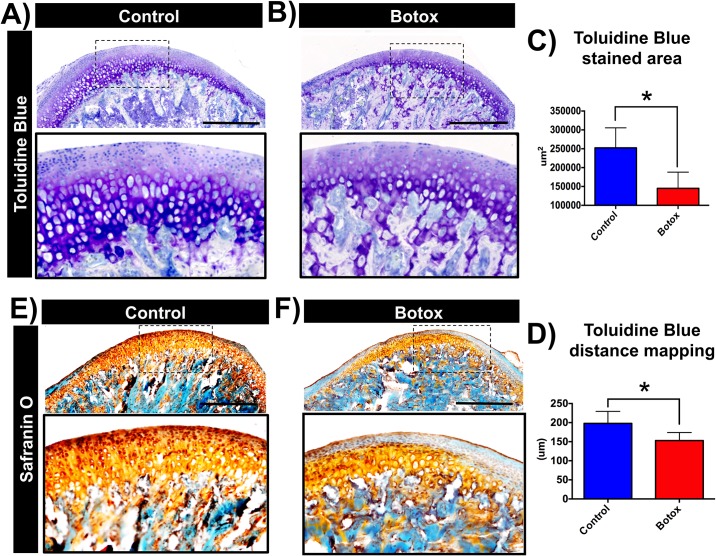
Fig 4. Reduced proteoglycan secretion at the Botox injected side MCC.
Sagittal sections of control (A) and Botox (B) injected side condyles stained for toluidine blue. C-F) Quantification of toluidine blue stained area and distance mapping at the MCC. Safranin O staining for control (E) and Botox injected side condyles (F). Histograms (C-D) represent means ± SD for n = 7 per group. * Significant difference between control and Botox injected side (p < 0.05). Scale bar = 500μm.

