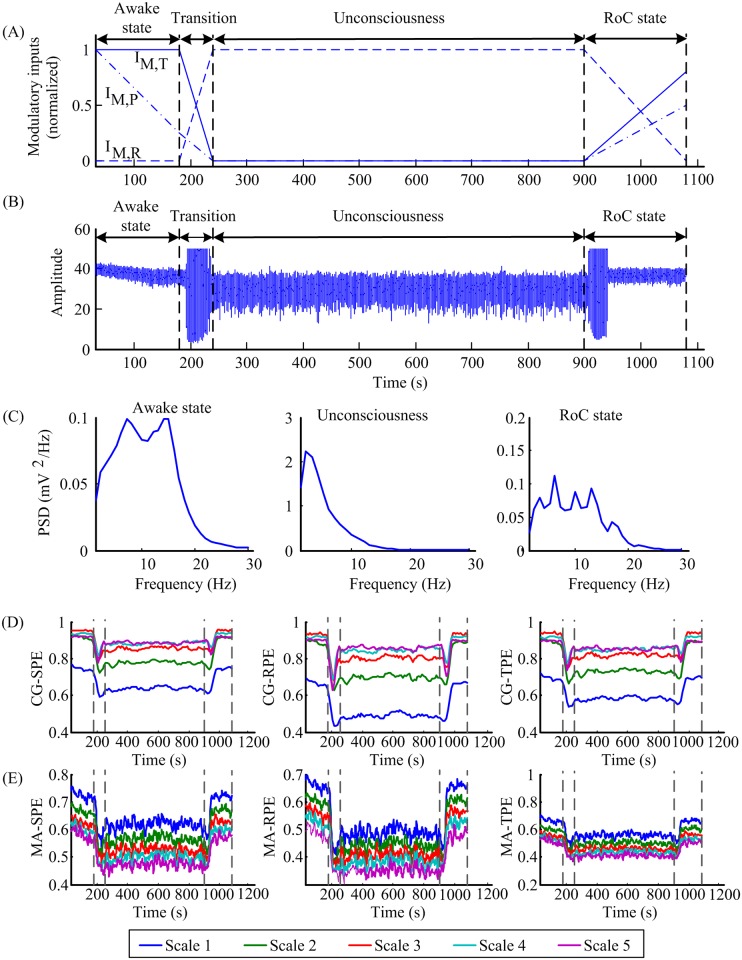
Fig 2. Simulated EEG signal generated by tuning three modulatory inputs and the corresponding MSPE indexes.
(A) Three normalized modulatory inputs changed with time. IM,T, IM,R and IM,P represent the inputs to TCR, TRN and pyramidal cells, respectively. (B) The simulated EEG signal obtained from the TCNMM model. (C) The power spectral densities of the signal in different anesthesia states. (D) The CG-SPE, CG-RPE and CG-TPE indexes computed from the generated signal. (E) The MA-SPE, MA-RPE, MA-TPE indexes computed from the generated signal. In (D-E), the MSPE indexes were delimited by vertical bars into four states: awake state, transition, unconsciousness and RoC state. IM,T, IM,R and IM,P represent modulatory inputs for the TCR, TRN and the pyramidal population, respectively.

