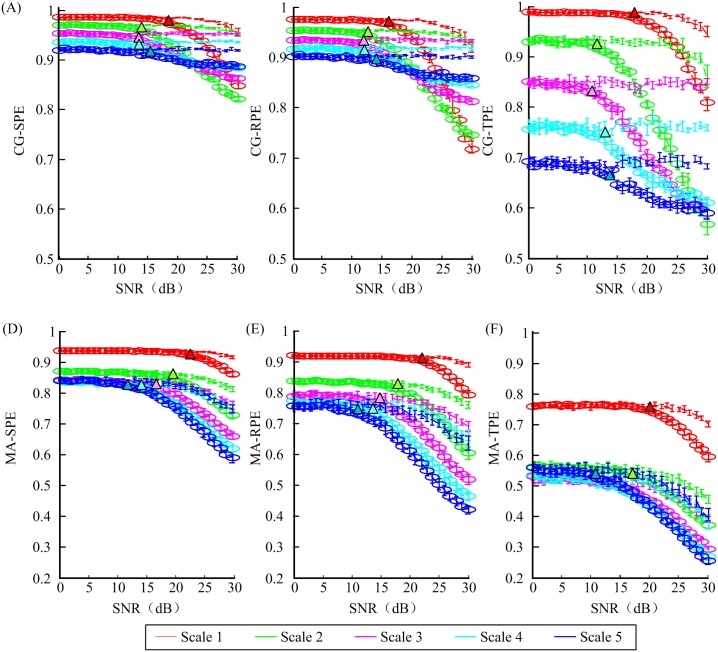
Fig 4. The values of six MSPEs versus signal to noise rate (SNR) in awake state (lines without circle) and unconsciousness (lines with circle).
Different colors represent different scales. Colored triangle symbols pointed out the SNR value where the indexes could tell awake state and anesthesia state apart.

