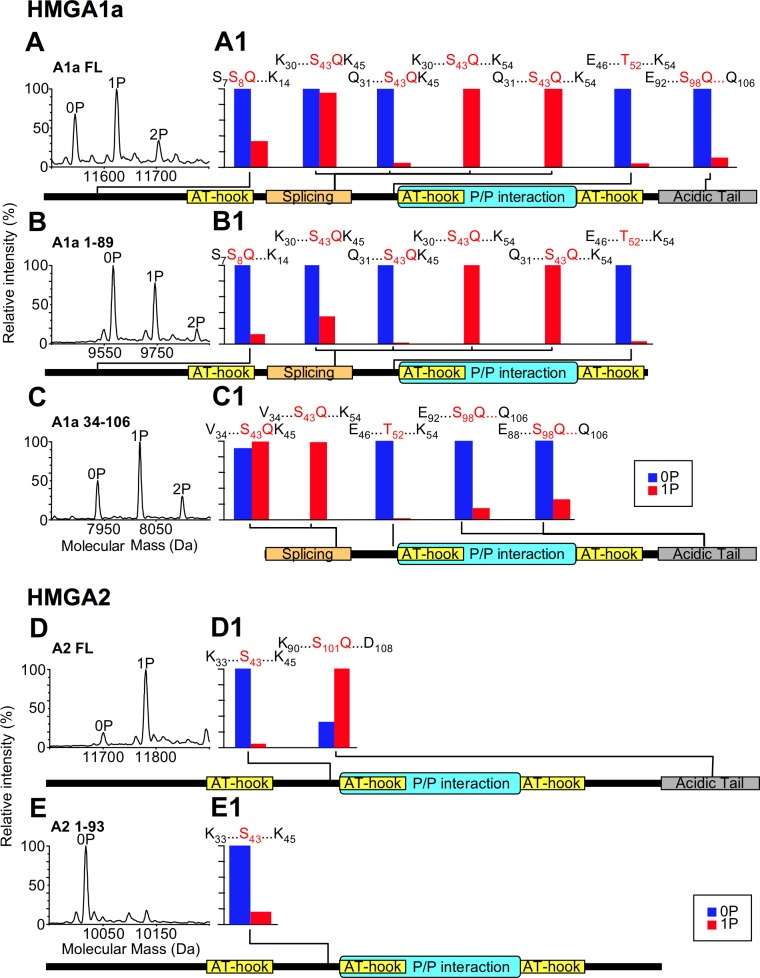
Fig 2. HMGA1a and HMGA2 are phosphorylated by DNA-PK.
Different recombinant HMGA1a protein forms (full-length (FL), 1–89, and 34–106) and HMGA2 protein forms (full-length (FL) and 1–93) were phosphorylated by DNA-PK for 16 h and analyzed by LC-MS. Reconstructed mass spectra of the phosphorylated proteins are reported in panels A-E; P indicates the phosphate group. Each protein form was digested by trypsin and peptides analyzed by LC-MS/MS. For each HMGA form (panels A1-E1), a schematic view reports the mass/charge (m/z) relative intensity of phosphorylated peptides (red bars) in comparison with their unmodified counterparts (blue bars). The identities of these peptides (given by first and last aminoacid residue), together with their modified S/T residues, are indicated. A schematic representation of the various HMGA1a forms allows to map the phosphorylation sites with respect to HMGA functional domains (AT-hook: DNA-binding domain; Splicing region: the aminoacid region lacking in HMGA1b splicing isoform; P/P interaction: protein/protein interaction domain; Acidic tail: acidic C-terminal tail).

