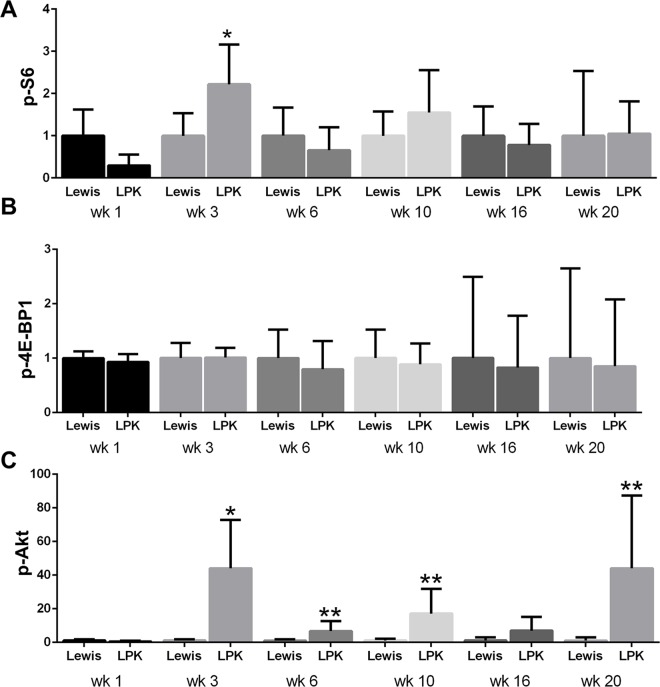
Fig 2. Quantitative analysis of renal p-S6, p-4E-BP-1 and p-Akt immunostaining in Study 1.
A. Time-course of p-S6 expression; B. Time-course of p-4EBP1 expression; C. Time-course of p-Akt expression. Data are expressed as mean±SD; *P<0.05 vs. Lewis for the corresponding time-point; **P<0.01 vs. Lewis for the corresponding timepoint; n = 3 rats per time-point for Lewis and n = 6 rats per timepoint for LPK.

