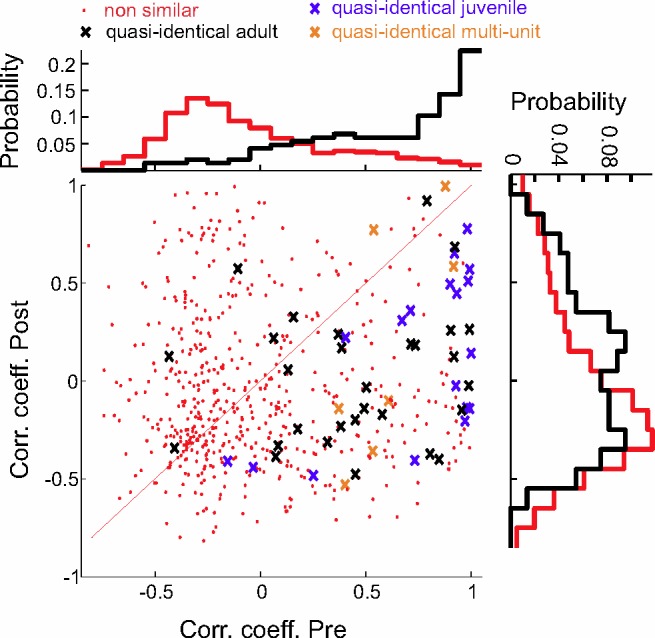
Fig 6. Scatter plot of firing stereotypy before and after quasi-repeated notes.

Plotted are CCs of binned firing rates before (pre) and after (post) quasi-identical notes (crosses) versus CCs among binned firing rates before (pre) and after (post) non-similar notes (red dots). Black crosses represent single units in adults, blue crosses single units in juveniles, and orange crosses multi-unit sites. Marginal point densities for single units are shown on top and on the right; they highlight the similarity of spike patterns before similar notes (black, top). Adult and juvenile data are pooled. All data can be downloaded as part of the supporting information files (S1 Data).
