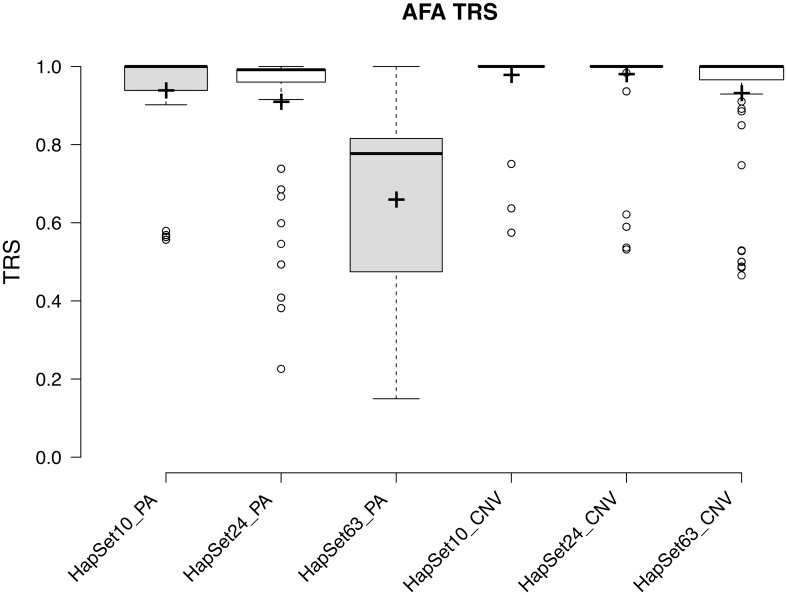
Fig 9. TRS distribution under PA and CNV resolutions for each HapSet.
Typing resolution scores are plotted for every AFA for whom CNV typing was available. Center lines show the medians; box limits indicate the 25th and 75th percentiles as determined by R software; whiskers extend 1.5 times the interquartile range from the 25th and 75th percentiles. All data points beyond this are outliers represented by dots. Crosses represent sample means; width of the boxes is proportional to the square root of the sample size. The size of each sample is labeled in the x-axis.

