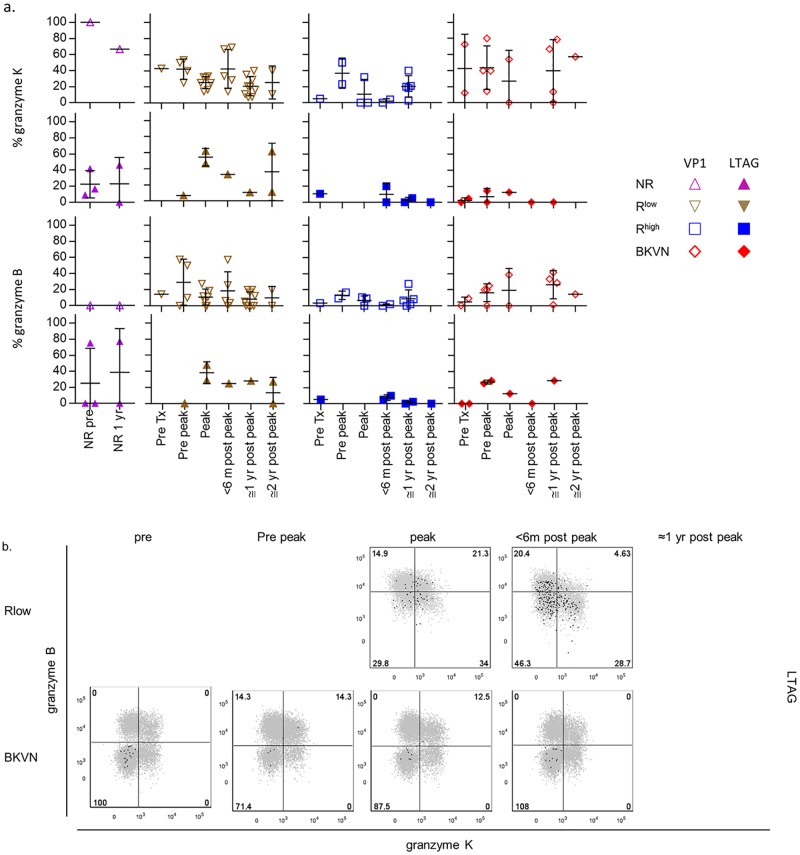
Fig 6.
(A) Scatter plots showing the expression frequencies of granzyme K (upper panel) and granzyme B (lower panel) by VP1- (open symbols) and LTAG-specific (closed symbols) CD8+ T cell populations detected in NR patients before—and one year after transplantation, and in the Rlow, Rhigh and BKVN RTRs during follow-up. (B) Representative dot plot overlays showing the fluorescence intensities of granzyme K and granzyme B with the total CD8+ T cell events shown in grey and LTAG-specific events in black from one Rlow patient (upper row) and one BKVN patient (lower row) during follow-up.

