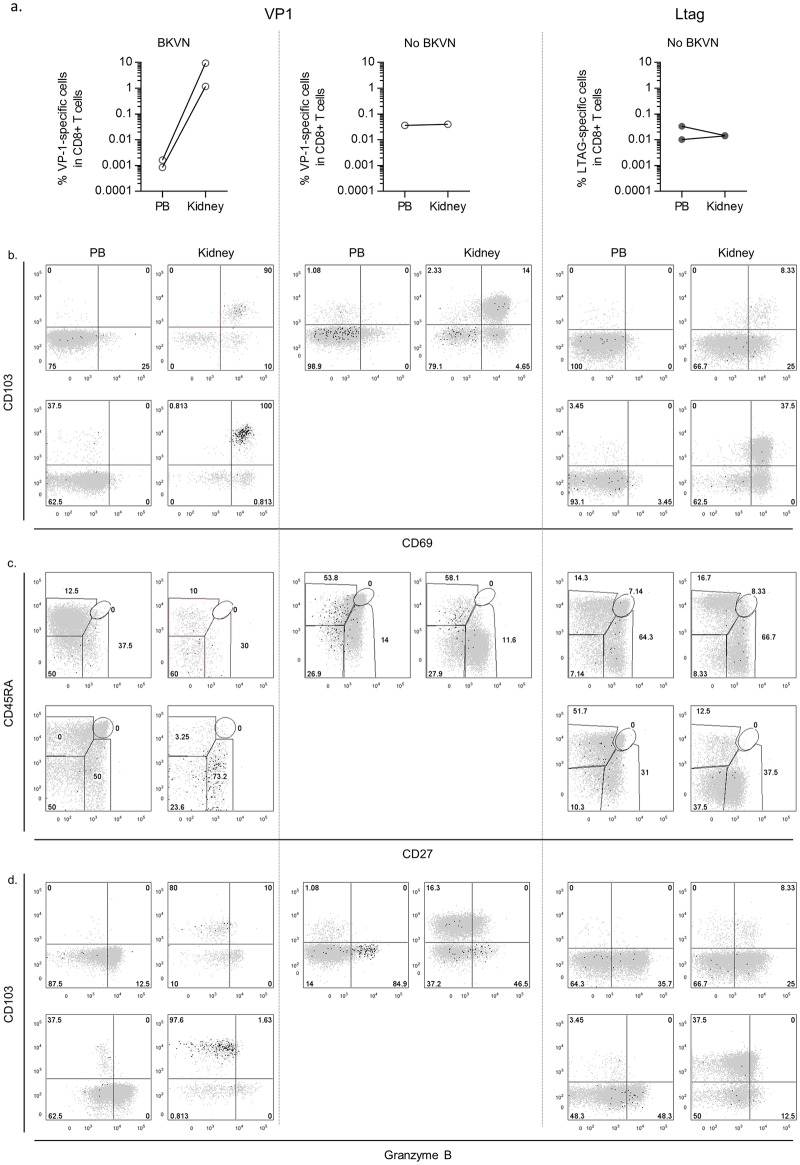
Fig 8.
(A) Line graphs showing the paired percentages of BKPyV VP1- and LTAG-specific CD8+ T cells amongst the total CD8+ T cell pool in the peripheral blood (PB) and in the kidney for 2 BKVN patients (first column) and three other RTRs (middle and right columns) (B) Dot plot overlays showing the fluorescence intensities of CD013 and CD69, and of (C) CD45RA and CD27, and (D) CD103 and granzyme B in the PB and in the kidney.

