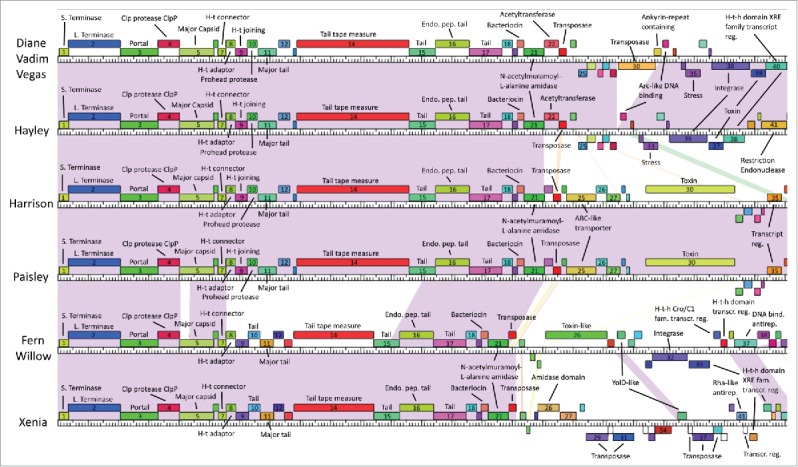
Figure 4.

Genome maps of our phages obtained from Phamerator (first half). Boxes represent genes, with boxes of the same color indicating genes in the same pham. Genes in a pham of their own are uncolored. Shaded areas indicate regions of high nucleotide sequence similarity between phages, with purple indicating the highest degree of similarity, and red the lowest.
