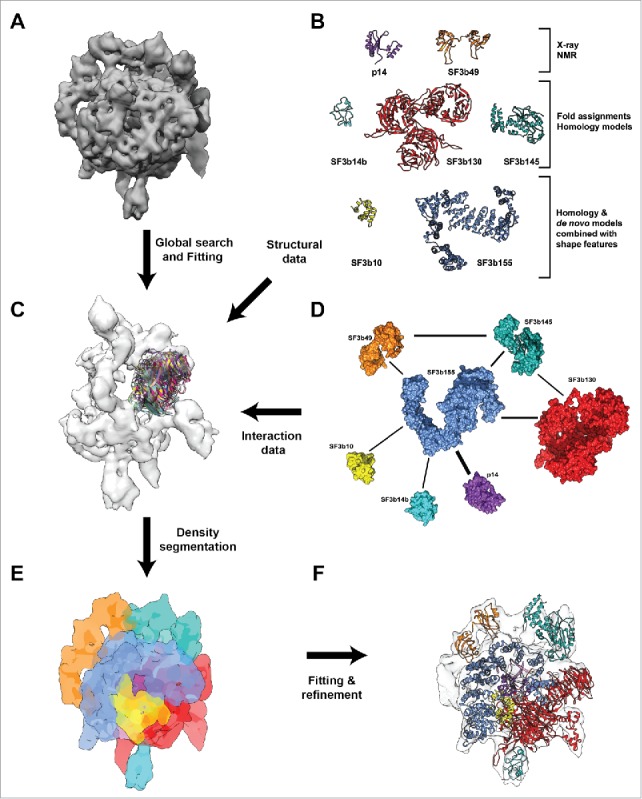
Figure 1.

Integrative structural modeling of Human SF3b complex. (A) A 9.7 Å cryo-EM map of SF3b complex displayed at the density threshold level of 0.0158. (B) Structural information for individual components of SF3b complex used to obtain the pseudo atomic model. (C) Global search and fitting for the individual domains of proteins SF3b130, SF3b145 and SF3b14b within the SF3b density region that is currently unoccupied. This was performed across different resolutions (9.7Å, 12Å, 15Å and 18Å) (Fig. S3–S6 and Materials and Methods). (D) Protein-Protein interaction network for the SF3b complex obtained from experimental data. The weights of the edges denote the number of unique experimental methods which showed physical interaction between individual components (Table S2). (E) Density segmentation and localization of individual components into the initial cryo-EM map. This was obtained by integration of several computational methods including fitting techniques, shape features from structural models and experimentally derived interactions among the components. (F) Atomic level representation of SF3b components after flexible fitting into the cryo-EM map, color coded as in B and C.
