Figure 2.
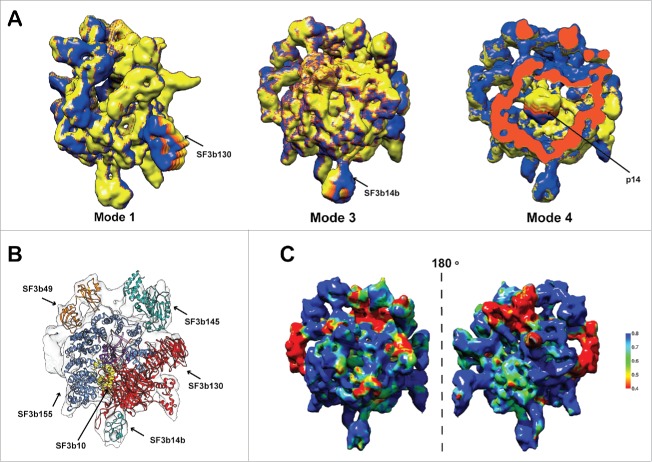
Flexibility and molecular architecture of Human SF3b complex. (A) Normal mode analysis of the density map and the associated conformational changes. The arrows show the regions of maximum flexibility observed in the corresponding low frequency modes where the proteins SF3b130 (mode 1), SF3b14b (mode 3) and p14 (mode 4) are located. The variations in the colors represent the different degrees of displacements in that particular mode. (B) Pseudo-atomic model of SF3b complex shown with the locations of its components. (C) Confidence assessment of atomic models by local correlation. The local cross-correlation was calculated for each voxel between the simulated density and the experimental density map with a grid size of 5×5 ×5 Å.

