Figure 5. Disruption of the complex formation of Cbx7-PRC1 facilitates the targeting of Cbx7 to chromatin.
(A) Normalized histograms of the log maximum likelihood diffusion coefficient for HaloTag-Cbx7 in wild-type mES cells replicated from Figure 1E and for HaloTag-Cbx7 in Ring1a−/−/Ring1b−/− (N = 29 cells, n = 2600 trajectories) and Bmi1−/−/Mel18−/− (N = 27 cells, n = 6859 trajectories) mES cells. The histograms were fitted with a three-component Gaussian. (B) Fraction of the CB (red), ID (cyan), and FD (green) population for HaloTag-Cbx7 in wild-type mES cells replicated from Figure 1F and for HaloTag-Cbx7 in Ring1a−/−/Ring1b−/− and Bmi1−/−/Mel18−/− mES cells. Results are means ± SD. (C–D) Residence time (C) and fraction (D) of the stable chromatin-bound population for HaloTag-Cbx7 in wild-type mES cells replicated from Figure 4C and D and for HaloTag-Cbx7 in Ring1a−/−/Ring1b−/− (N = 18 cells, n = 4849 trajectories) and Bmi1−/−/Mel18−/− (N = 27 cells, n = 3484 trajectories) mES cells. (E) Survival probability for HaloTag-Cbx7 in wild-type mES cells replicated from Figure 4E, and for HaloTag-Cbx7 in Ring1a−/−/Ring1b−/− and Bmi1−/−/Mel18−/− mES cells.
DOI: http://dx.doi.org/10.7554/eLife.17667.045

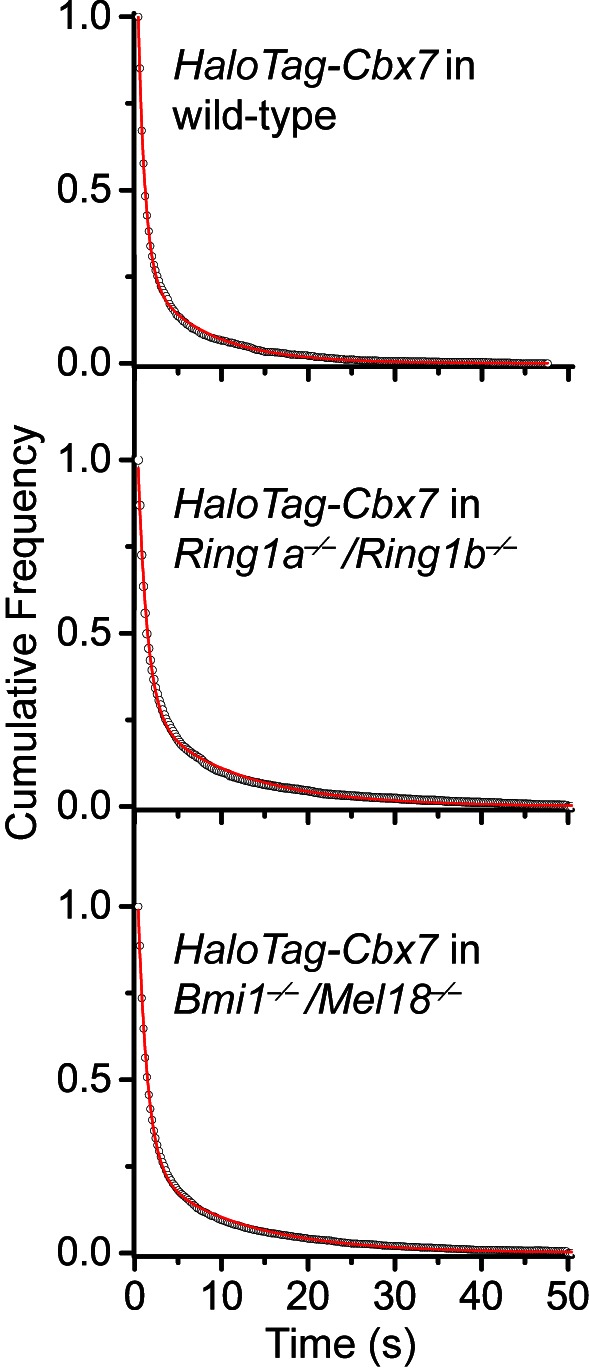
Figure 5—figure supplement 1. Cumulative frequency distribution of the dwell times for determining the residence times of HaloTag-Cbx7 in Ring1a−/−/Ring1b−/− and Bmi1−/−/Mel18−/− mES cells.