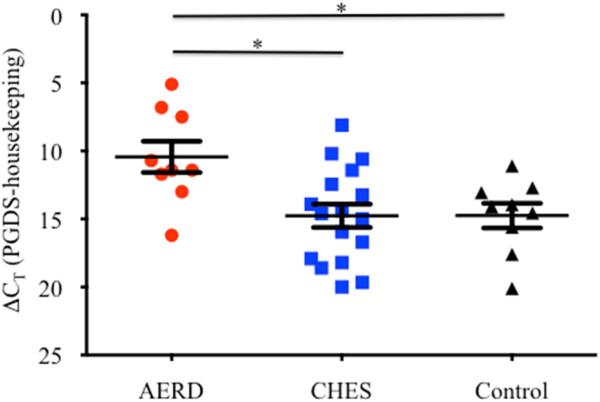
Figure 1. hPGDS gene expression in sinus tissue by qPCR.
Tissue samples were homogenized following surgical removal and RNA isolated. Transcript levels of hPGDS were quantified using PCR with sybr-green detection. Data (mean±SEM) reflect relative expression of each gene in comparison to the housekeeping gene EF1α (ΔCT). Control samples (n=9) are depicted in black triangles, CHES (n=17) in blue squares and AERD (n=9) in red circles. *p<0.02 as compared to CHES and Control.

