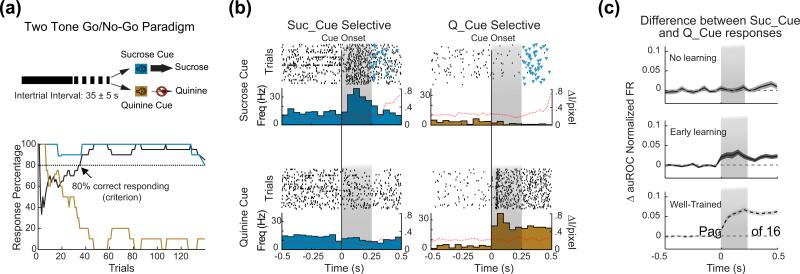
Figure 2.
Cross-modal cue responses in the gustatory cortex can encode specific expectations of rewarding or aversive tastants. a) Go/no go paradigm. Top: schematic of the behavioral paradigm; one auditory cue predicts the availability of sucrose; the other cue predicts the availability of quinine. Rats press a lever following the sucrose predicting cue (Suc_Cue) and self-deliver sucrose directly into their mouth. On the contrary, rats refrain from pressing following the quinine-predicting cue (Q_Cue). Bottom: representative behavioral record a session. The plot shows the percentage of trials for Suc_Cue (cyan) and Q_Cue (gold) followed by a lever pressing. The solid black line indicates the average performance. b) Selectivity of cue responses. Raster plots and peri-stimulus histograms (PSTHs) for two representative units, one selective for Suc_Cue (blue, left) and one selective for Q_Cue (right, gold). The dotter line overlaying the PSTHs shows the time course of the magnitude of mouth movements. Time 0 represents the onset of the auditory cue. Triangles markers represent lever-presses. The gray shading indicates the temporal window in which only the cue was present, without any lever-press. c) Emergence of cue selectivity with learning. The three plots depict the difference in normalized firing between responses to Suc_Cue and Q_Cue averaged across neurons. A flat line indicates no difference between cue responses (hence no cue selectivity). Each plot features data from animals at different stage of learning. Top: rats not showing any sign of learning in the first few sessions; middle: rats showing learning in the first few sessions; bottom: rats extensively trained. Notice how the difference between cue responses (i.e., the selectivity) increases with learning. Time 0 and gray shadow as in panel b. Dotted horizontal line represents zero difference. Panels a-c) modified from Gardner and Fontanini [49].

