
Figure 2.
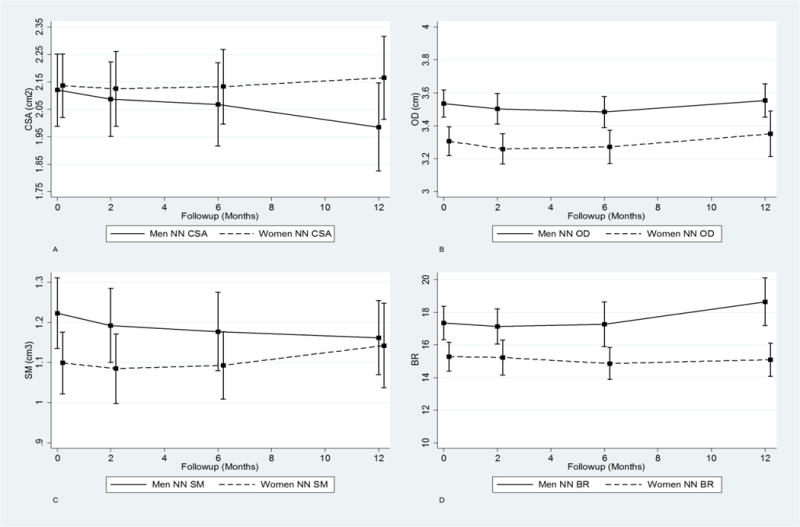
Trajectory plots of adjusted absolute values for the one-year post fracture recovery period for NN CSA (A), OD (B), SM (C), and BR (D).
Official websites use .gov
A
.gov website belongs to an official
government organization in the United States.
Secure .gov websites use HTTPS
A lock (
) or https:// means you've safely
connected to the .gov website. Share sensitive
information only on official, secure websites.
Trajectory plots of adjusted absolute values for the one-year post fracture recovery period for NN CSA (A), OD (B), SM (C), and BR (D).