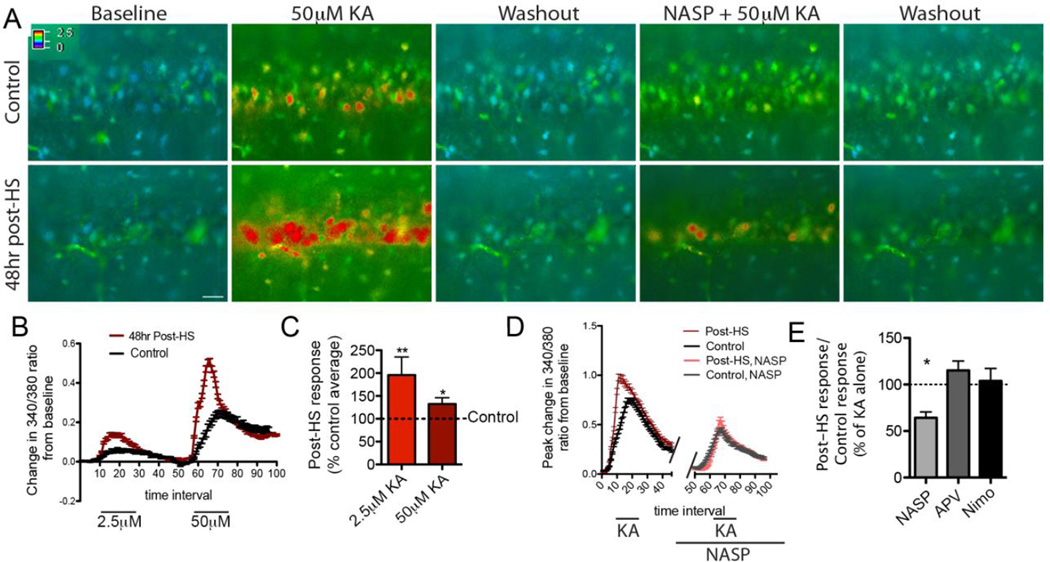
Figure 1. Peak Ca2+ response to KA increases 48 hours post-HS and is mediated by CP-AMPARs.
A) Time-lapse ratiometric fura-2 imaging in CA1 in slices from post-HS (bottom) and littermate control (top) rats demonstrating the change in 340/380 ratios in response to KA before and after incubation with NASP; Bar= 30µm. B) Example of 340/380 ratios in response to 2.5 and 50µM KA in multiple cells averaged in one post-HS (red) and one control slice (black). C) Quantification of peak change in 340/380 ratio shows that response to 2.5 or 50µM KA is significantly higher in CA1 pyramidal neurons 48 hours post-HS (mean response to 2.5µM KA=0.23±0.05, n=6 rats; response to 50µM KA=0.67±0.07, n=10 rats) than in controls (2.5µM KA=0.12±0.02, n=6 rats, p=0.01 by repeated measures ANOVA, 50µM KA=0.51±0.07, n=10 rats p=0.049 by repeated measures ANOVA), represented together here as a percent of the control average indicated by the dotted line. D) Quantification of change in 340/380 ratio from baseline in multiple cells from one control (black) and one 48 hours post-HS slice (red) before and after NASP treatment; n=7 slices/group, p=0.02 by t-test. E) Quantification of peak responses with and without NASP, APV and nimodipine as a ratio of post-HS responses to that of littermate controls illustrates that NASP, but not APV or nimodipine render equivalent peak Ca2+ responses to KA from cells in post-HS and controls (n=5–8 slices/group; see text). Data is represented as mean±SE.

