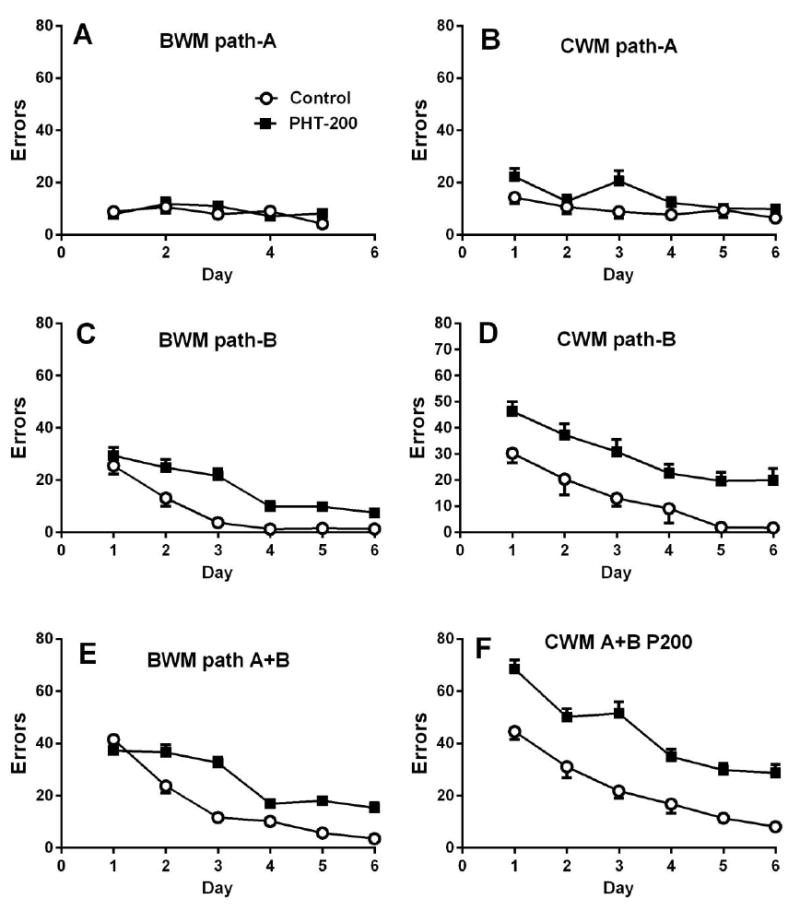
Fig. 4.

Comparison of the effects of prenatal phenytoin (PHT) on BWM vs. CWM in rats (Vorhees, 1987b). Data are Mean ± SEM errors. Note the large differences in outcome between the two mazes (ordinates are on the same scale for comparative purposes). In this experiment gravid Sprague-Dawley rats were administered 0, 100, 150, or 200 mg/kg of PHT on E7-18. For simplicity only the PHT-200 and Control groups are redrawn here. Rats all received 5 trials in a 127 cm straight water channel the day before maze trials. Significance indicators (asterisks) have been removed for this comparison. See text for which effects were significant. There were 6 trials in both mazes for path-B and in the CWM for path-A but only 5 trials in the BWM on path-A, therefore, the BWM path-A trial-6 data point is an estimate extrapolated from the slope of this group’s curve.
