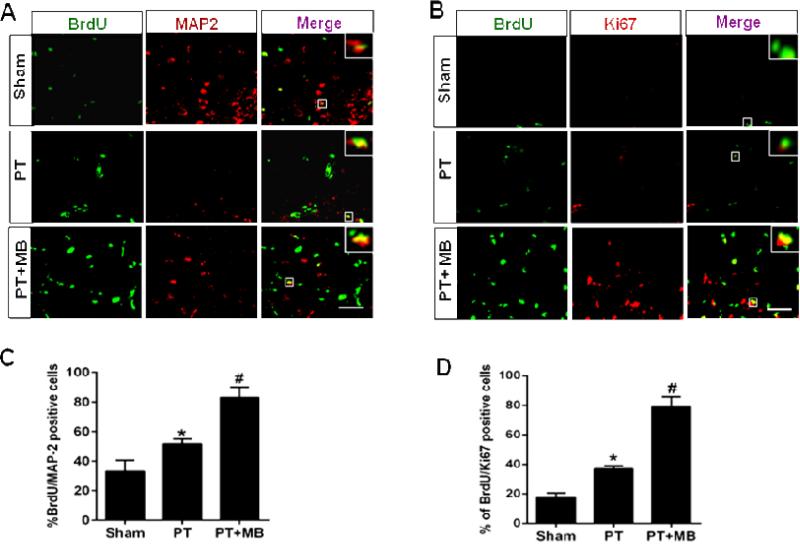
Fig. 4. Effect of MB on the expression of BrdU/MAP2 and BrdU/Ki67 in the cortical peri-infarct region as seen 12 days after PT stroke.
Representative confocal microscopy images of the indicated markers represent that MB treatment significantly increases the expression and colocalization of BrdU/MAP2 (A) and BrdU/Ki67 (B) in the peri-infarct region cortical region following PT stroke. Quantative analyses of BrdU/MAP2 and BrdU/Ki67 are shown in (C, D). Values are expressed as mean ± SE (n=6). Magnification: 40×, scale bar: 50 μm. *P < 0.05 versus sham, #P < 0.05 versus PT group.

