
Figure 2. NINA-SUD temperature profile.
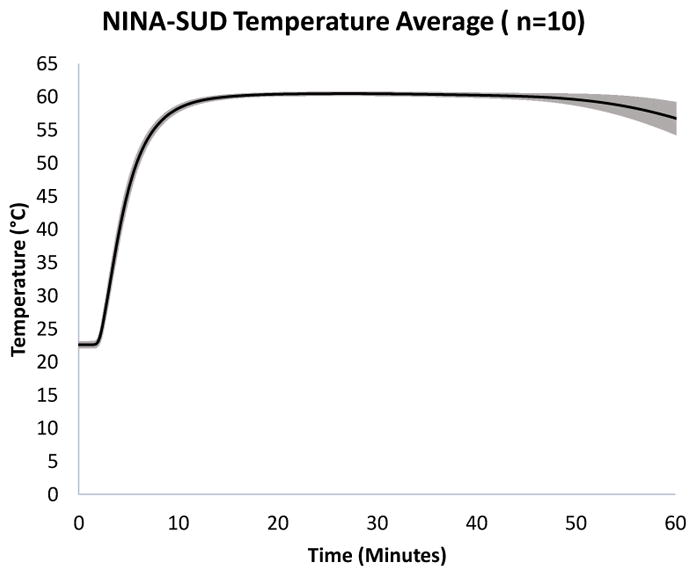
The average temperature of 10 NINA-SUD test devices (black line), recorded for 60 minutes post-initiation of chemical reactants. The shaded gray area of the plot represents the standard deviation.
Official websites use .gov
A
.gov website belongs to an official
government organization in the United States.
Secure .gov websites use HTTPS
A lock (
) or https:// means you've safely
connected to the .gov website. Share sensitive
information only on official, secure websites.
The average temperature of 10 NINA-SUD test devices (black line), recorded for 60 minutes post-initiation of chemical reactants. The shaded gray area of the plot represents the standard deviation.