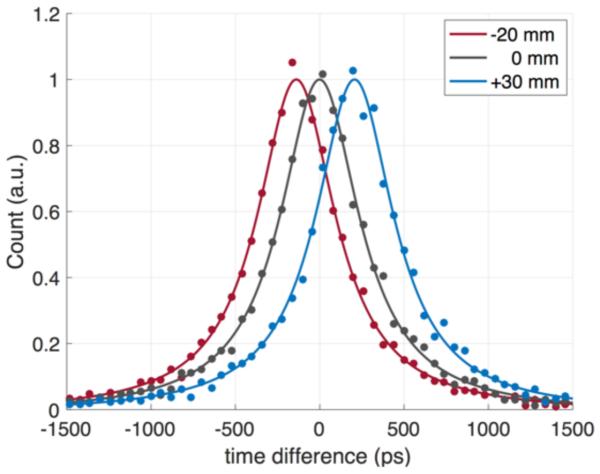
Figure 6.
Timing spectra measured with two 3 × 3 × 20 mm3 BGO crystals coupled with NUV-HD SiPMs, using a 22Na point source located at three different positions of −20 mm (red), 0 mm (gray), and +30 mm (blue) relative to the center point between the two crystals. The CRT values at three different positions were 555 ps, 561 ps, and 553 ps, respectively.

