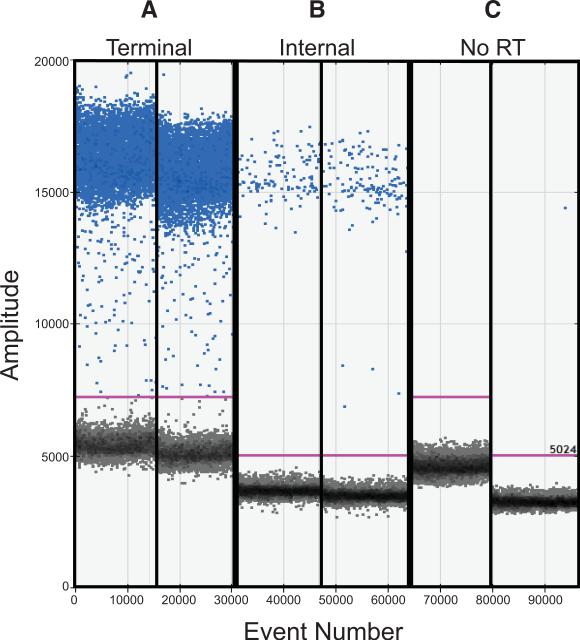
Figure 2. Droplet digital PCR separates droplets into template-positive and template-negative populations.
Raw data obtained by ddPCR with cDNA derived from Pan/99wt-His MDCK P3 virus are shown. The fluorescence amplitude of each droplet analyzed is indicated on the Y-axis and the event number, or order in which droplets were screened, is plotted on the X-axis. Positive droplets are colored blue and negative droplets are grey. A) Duplicate samples combined with terminal primers targeting PB1 show a high number of positive droplets. B) Duplicate samples combined with internal primers targeting PB1 show relatively few positive droplets. C) Negative controls in which no-RT control samples were combined with each pair of primers are shown.

