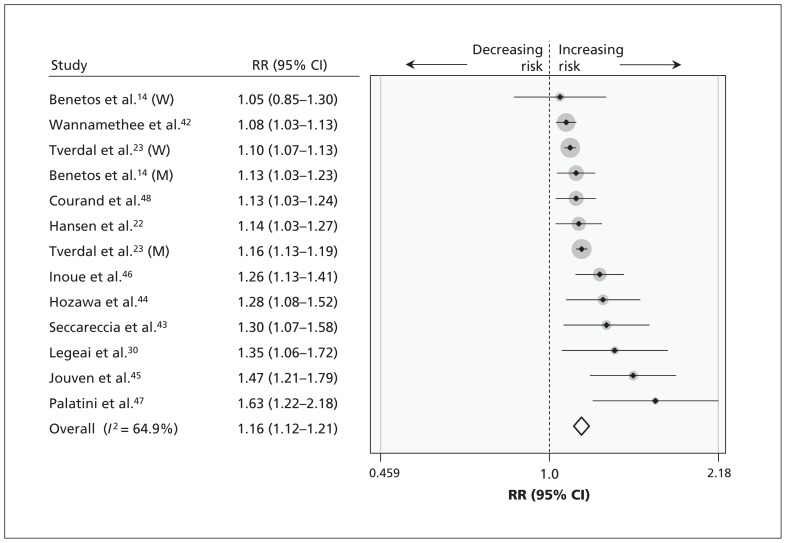
Figure 2:
Forest plot of each increment in resting heart rate of 10 beats/min in relation to risk of noncardiovascular diseases. The size of each grey circle is proportional to the weight assigned to that study. Covariable-adjusted risk estimates were used because the raw numbers were not provided in the original studies. Note: CI = confidence interval, M = men, RR = relative risk, W = women.

