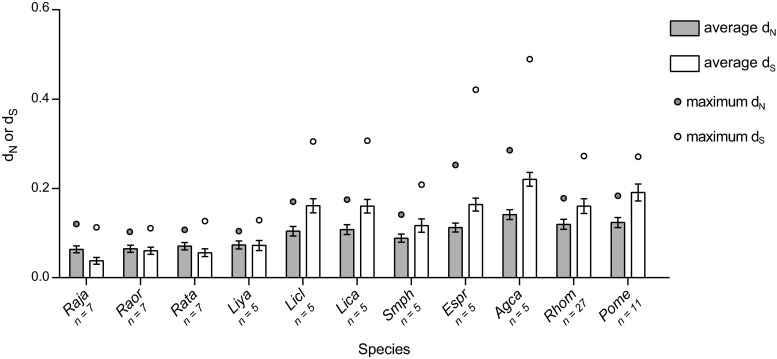
Fig. 3.
Average number of non-synonymous differences per non-synonymous site (d N, grey bars) or synonymous differences per synonymous site (d S, white bars) in MHC class I of various frog species using the Nei–Gojobori model (proportion) with 1000 bootstrap replicates. Error bars represent standard error estimates; circles represent maximum d N or d S from a pair of variants. Sequences from other anuran species were characterised by Kiemnec-Tyburczy et al (2012) and Zhao et al (2013)

