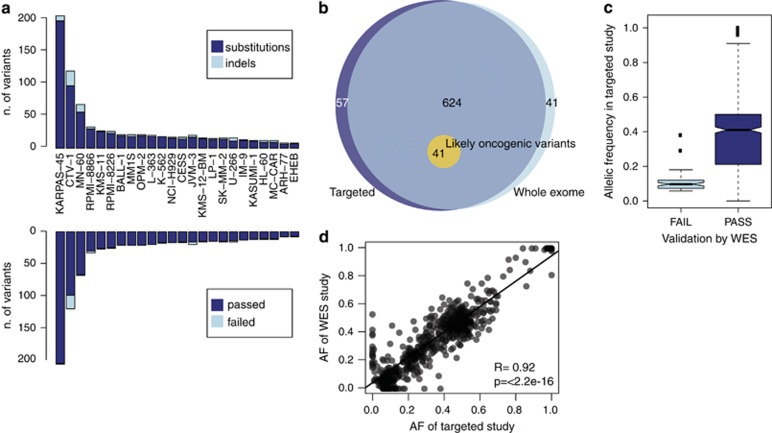
Figure 2.
Validation of variants in the study. (a) Histogram showing the absolute number of variants broken down by type (top) or by validation from a previous whole-exome sequencing study (bottom). (b) Venn diagram showing the overlap of variants as called by a whole-exome sequencing study (light blue), our targeted sequencing study (dark blue) and the accuracy in reporting ‘likely oncogenic variants'. (c) Boxplot representing the allelic ratio of variants in our targeted study that were confirmed by whole exome (dark blue) or not confirmed (light blue). (d) Scatter plot confirming a strong correlation of the allelic frequency of variants reported by whole exome or by our target-enrichment study.

