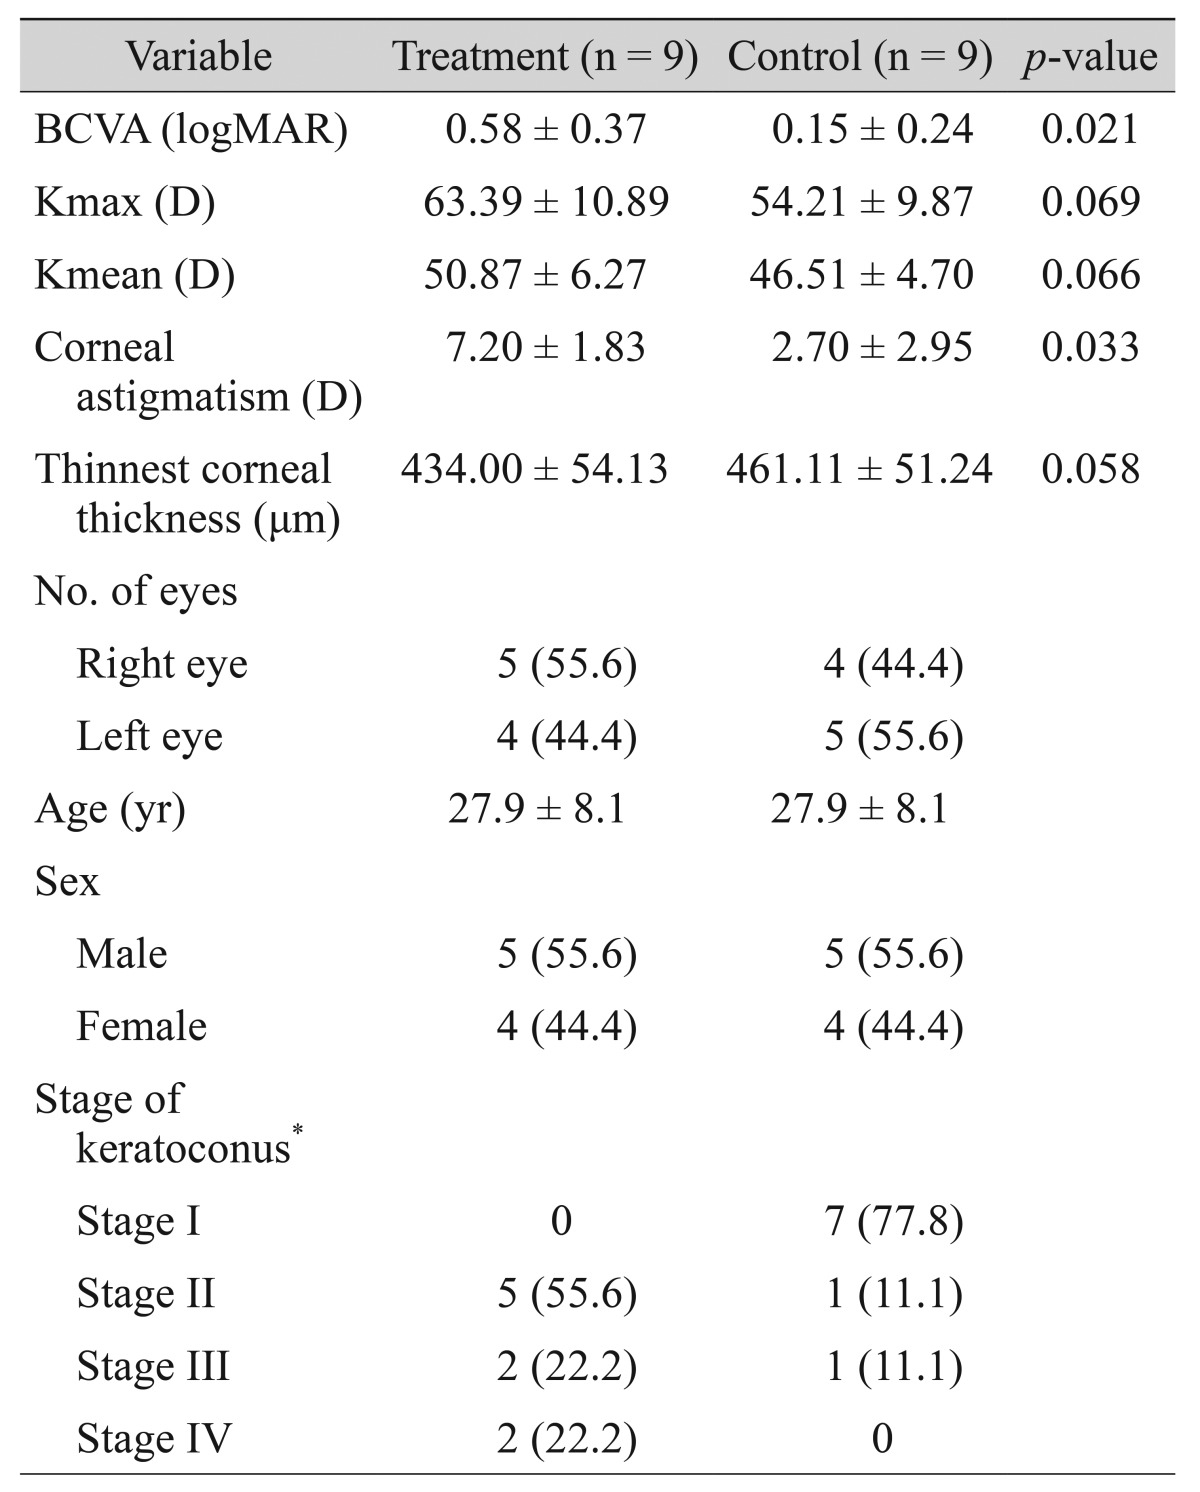
Table 1. Baseline demographic and clinical characteristics of the eyes in the treatment and control groups.
Values are presented as mean ± standard deviation or number (%).
BCVA = best-corrected visual acuity; logMAR = logarithm of minimum angle of resolution; Kmax = maximum keratometry; D = diopter; Kmean = mean keratometry.
*Amsler-Krumeich classification.

