
Figure 5.
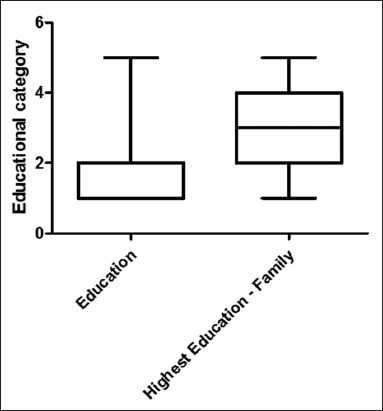
A box and whiskers plot illustrating Education of the respondents to the highest education in the respondents family. The bold line indicates the median. Whiskers represent the 5th and 95th percentiles with lines below and above representing the 0-5th and 95-100th percentiles, respectively. Outliers are indicated by individual points (Category: 1 - Primary education; 2 - SSLC; 3 - Higher secondary; 4 - Undergraduates; 5 - Post-graduates).