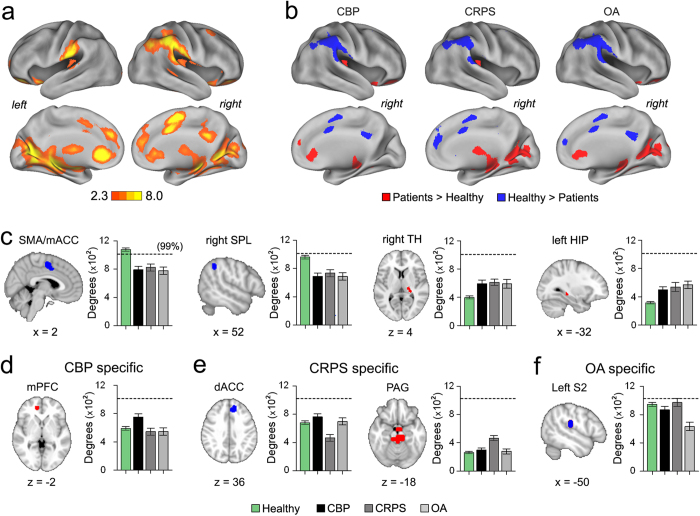
Figure 3. Chronic pain conditions have common and specific local nodal degree changes.
(a) Cortical surface maps for difference in nodal degree across all groups for 10% link density analysis (whole-brain voxelwise ANCOVA with age and gender as covariates of no interest, f – zscore > 2.3, p < 0.01, FWE corrected using threshold – free cluster enhancement). (b) Cortical surface maps illustrate nodes that show differences between patients and our healthy controls for 10% link density analysis (Tukey post - hoc compared to healthy, 0070 < 0.05 FDR corrected). Red denotes significantly increased degree and blue denotes significantly decreased degree in CBP, CRPS and OA compared to healthy. (c) Brain slices show regions that exhibited common decreases (blue) and increases (red) in nodal degree in all patients compared to our healthy subjects (conjunction of statistical maps in Fig. 2b). Brain regions that showed decreased connections included SMA/mACC and right SPL and brain regions that showed significant increases included right TH and left HIP. Bar graphs show the corresponding mean ± s.e.m of nodal degree. (d–f) Brain regions that showed patient specific nodal degree changes for CBP, CRPS and OA compared to all other patient groups and healthy subjects (regions were determined using a conjunction analysis of relevant post-hoc comparisons, see Supplementary Fig. 5). CBP patients showed increased nodal degree in mPFC CRPS showed decreased nodal degree in dACC and increased nodal degree in PAG; OA patients exhibited decreased nodal degree in left S2. Bar graphs show the corresponding mean ± s.e.m of nodal degree. Dashed line represents the 99 percentile for degree counts in our healthy group. Coordinates and cluster sizes for all regions that showed nodal degree changes are listed in Supplementary Table 6.

