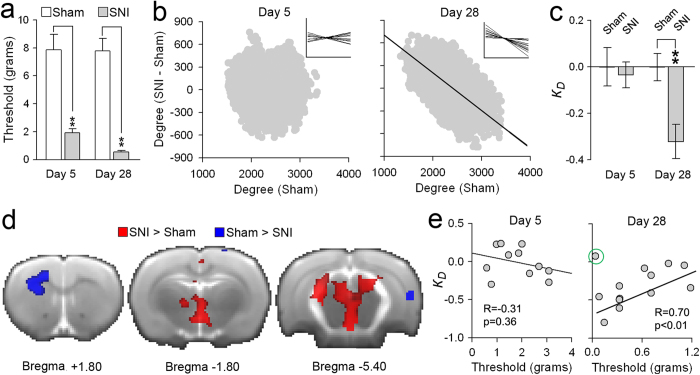
Figure 6. Degree rank order disruption of brain functional networks in rats with spared nerve injury (SNI).
(a) Mean ± s.e.m. for tactile sensitivity threshold of the injured paw in two groups of SNI and sham animals, day 5 (sham: n = 12, SNI: n = 11) and day 28 (sham: n = 11, SNI: n = 13) post-injury. Both SNI groups exhibited decreased mechanical thresholds (tactile allodynia, pain-like behavior) compared to sham animals, day 5 (sham: 7.89 ± 1.21 grams; SNI: 1.91 ± 0.03 grams; t(21) = −5.21, p = 0.005) and day 28 (sham: 7.78 ± 1.07 grams; SNI = 0.62 ± 0.01 grams; t(22) = −9.19, p < 0.001) (**p < 0.01, two-sided unpaired t-test). (b) Scatter plots depict the group kD of resting state functional networks in SNI animals for 10% link density, in comparison to time-matched sham animals degree counts. Inserts show kD computed for each animal. (c) Mean ± s.e.m for kD in SNI animals, compared to sham at day 5 and day 28. SNI showed a significant degree rank disruption at day 28 (mean ± s.e.m. = −0.32 ± 0.07, t(22) = −3.40, p = 0.004), but not at day 5 (mean ± s.e.m. = −0.01 ±0.1, t(21) = −0.11, p = 0.91) (**p < 0.01, two-sided unpaired t-test). (d) Group differences in degree between SNI and sham at day 28. Areas depicted in red represent increased degree in SNI, and include PAG, ventral tegmentum, hypothalamus, thalamus, and cingulate and NAc shell. Regions in blue show decreased degree in SNI, and include primary sensorimotor, caudate and hippocampus (whole brain contrast p < 0.05 corrected for multiple comparisons using FWE). There were no differences in degree at day 5, relative to day 5 sham. (e) Correlations between kD and tactile sensitivity in SNI animals, at days 5 and 28. SNI animals showed a significant correlation between kD and tactile sensitivity at day 28 (R = 0.70, p = 0.009, data point delineated by green circle was excluded from the regression), but not at day 5 (R = −0.31, p = 0.36).

