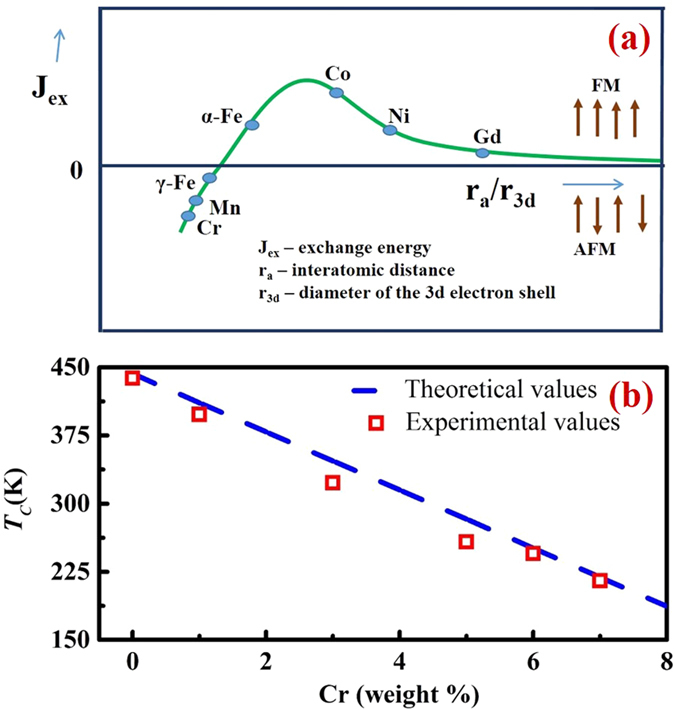
Figure 4.

(a) The Bethe-Slater curve (schematic) showing the dependence of the exchange interaction on the ratio of interatomic distance to the diameter of the 3d electron shell46 (b) Phase diagram for the ternary system (Fe70Ni30)100−xCrx for x = 0 to 8. Dashed blue line represents the values predicted from the equation TC = TC1 + (TC/dc) (c) while points (red square) are experimental results.
