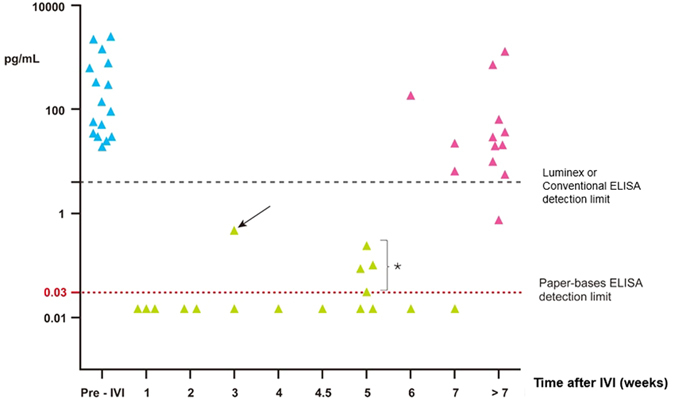
Figure 3. Aqueous VEGF levels before and after intravitreal injection of anti-VEGF antibody.

Blue dots represent VEGF levels before IVI (group 1). Black dots represent VEGF concentrations after IVI. The horizontal red dotted line is the detection limit of paper-based ELISA, approximately 0.03 pg/mL. The horizontal black dashed line is the detection limit of conventional ELISA or Luminex, approximately 4–5 pg/mL. The earliest elevation of VEGF was found in a patient with PCV at 3 weeks after IVI (arrow). Four earlier elevations of VEGF levels were found 5 weeks after IVI injection by ultrasensitive paper-based ELISA (asterisk).
