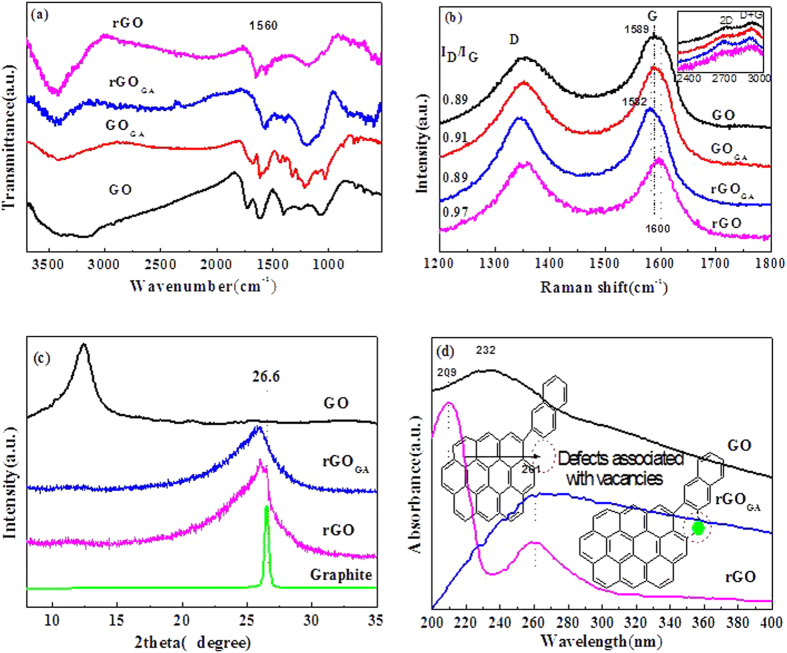
Figure 5.
(a) ATR-IR spectra of GO, GOGA, rGOGA, and rGO. (b) Raman spectra of GO, GOGA, rGOGA, and rGO. (c) XRD patterns of graphite, GO, rGOGA and rGO powder. The 2θ angles of the XRD peaks (d-spacing) of GO and rGOGA shifted from 12.4° (d-spacing ~0.8 nm) to 25.8° (d-spacing ~0.34 nm) after reduction. (d) UV-vis absorption spectra of GO, rGOGA and rGO.

