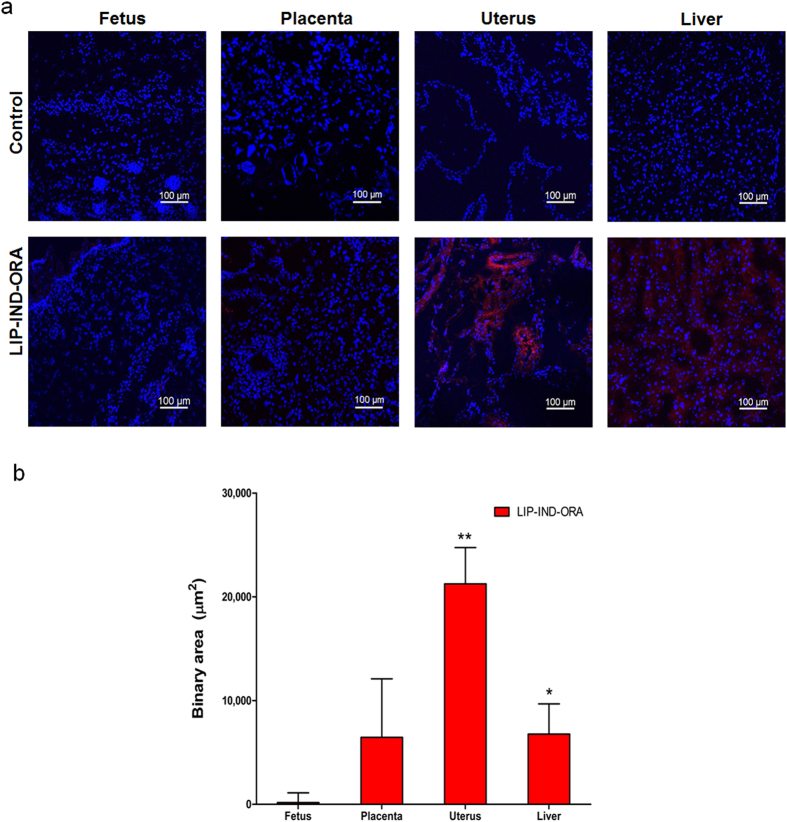
Figure 3. Biodistribution of LIP-IND-ORA components in vivo in pregnant mice.
(a) Qualitative analysis of LIP-IND-ORA tissue distribution in the maternal uterus and liver, placenta and in the fetus of pregnant mice. Red: LIP-IND-ORA (lissamin rhodamin labeled phospholipid); Blue- DAPI, nuclear stain. (b) Quantification of the LIP-IND-ORA fluorescent signal in the tissues normalized to tissue auto-fluorescence using NIS elements. Quantitative biodistribution of liposome was obtained from at least 9 randomly selected fields per mouse of each organ. Mean ± SEM, n = 6. *p-value < 0.05, **p-value < 0.01 to fetus.

