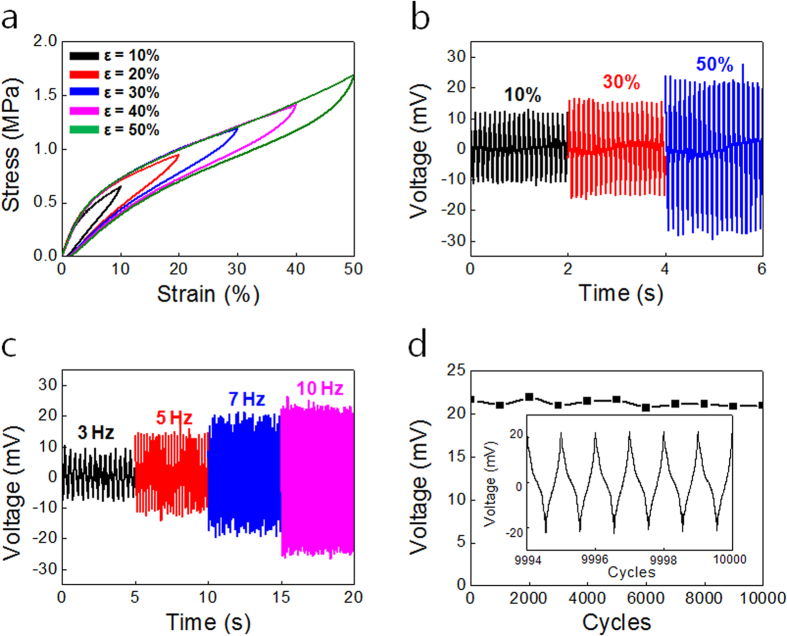
Figure 3. Mechanical property and energy generation performance of the stretchable triboelectric fiber.
(a) Stress–strain curve of a triboelectric fiber after repeated stretching to different maximum strain from 10% to 50% and then released. The voltage response was measured for (b) varying strain ranging from 10% to 50% with a frequency of 10 Hz and (c) varying frequency from 3 Hz to 10 Hz at an applied strain of 50%. (d) The stability of the performance generated from the triboelectric fiber during 10,000 cycles to a maximum strain of 50% and at a 10 Hz frequency.

