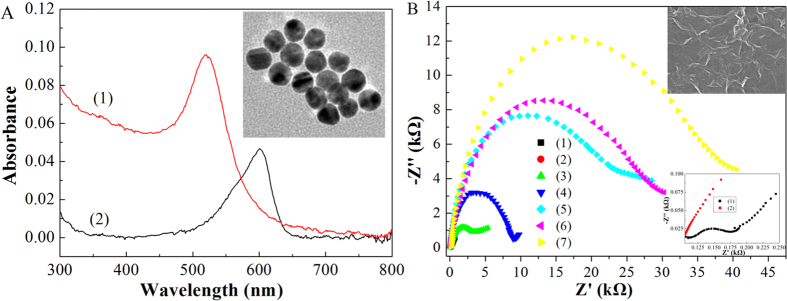
Figure 2.
(A) UV-visible spectra of the aqueous solution of AuNPs (1) and aptamer-Au-Th bioconjugate (2). Inset (a) is a TEM image of AuNPs. (B) Nyquist plots of 10 mM [Fe(CN)6]3−/4− in 0.1 M KCl from 0.1 MHz to 0.1 Hz at ac amplitude of 5 mV under open-circuit potential conditions, obtained at the naked GC electrode (1), and the GC electrodes after the modification of carboxyl graphene (2), the activation of NHS/EDC (3), the immobilization of antibody (4), the recognition of Aβ oligomers (5), the blocking by BSA (6), and the binding of aptamer-Au-Th bioconjugate (7). Inset (b) is a SEM image of (2). Inset (c) is the magnified Nyquist plots for (1) and (2).

