
Figure 5. DPV curves of an increasing concentration of Aβ oligomers in 0.1 M PBS (pH 7.4) using the antibody-aptamer sandwich assay.
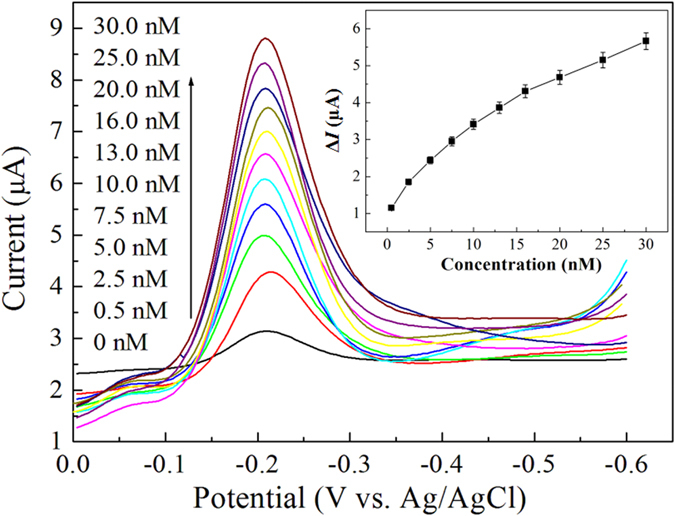
Inset is the linear calibration plot of (Ip − I0) value vs. the concentration of Aβ oligomers.
Official websites use .gov
A
.gov website belongs to an official
government organization in the United States.
Secure .gov websites use HTTPS
A lock (
) or https:// means you've safely
connected to the .gov website. Share sensitive
information only on official, secure websites.
Inset is the linear calibration plot of (Ip − I0) value vs. the concentration of Aβ oligomers.