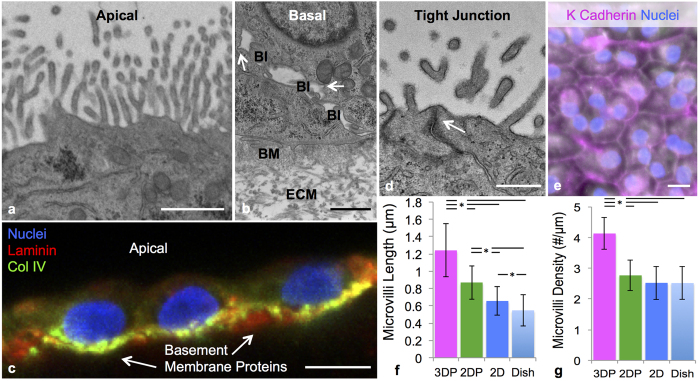
Figure 3. 3D proximal tubules form a tissue-like polarized epithelium.
(a) TEM image of the brush border on the apical side of PTECs at 6 weeks, scale bar = 1 μm, (b) TEM image of the basal side of PTECs at 6 weeks highlighting the presence of the engineered extracellular matrix (ECM), basement membrane proteins secreted by the cells (BM), basolateral interdigitations (BI), and circular invaginations in the membrane marked with white arrows, scale bar = 1 μm, (c) PTECs at 6 weeks showing the basement membrane proteins the cells secreted, namely laminin (predominant protein in red) and collagen IV (green), scale bar = 10 μm, (d) tight junction (white arrow) between PTECs in the bioprinted tubule, scale bar = 500 nm, (e) the cell junction protein K Cadherin (magenta) stained in the PT, scale bar = 10 μm, (f) microvilli length and (g) microvilli density quantified through TEM images of the 3D PT constructs (3DP) as well as three 2D controls (2DP = PTECs on ECM in 2D with perfusion, 2D = PTECs on ECM in 2D without perfusion, Dish = bare tissue culture dish without perfusion), p < 0.001.

