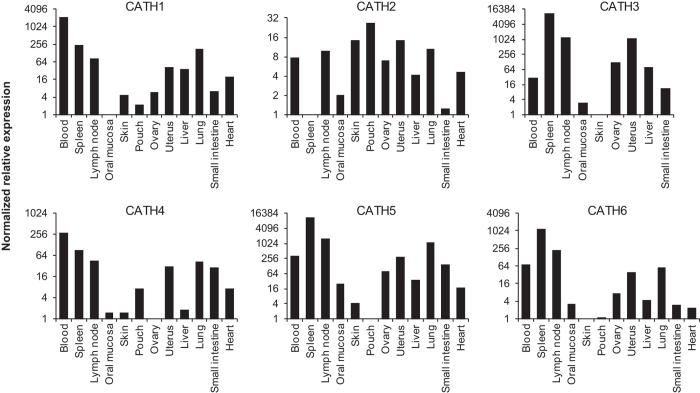
Figure 2. Relative fold expression of Tasmanian devil cathelicidin genes in different tissues.
For each cathelicidin, relative expression was calculated in comparison to the tissue with the lowest expression (i.e. the tissue with fold 1 expression in each graph). Three tissues (pouch, lung, and heart) that showed no detectable Saha-CATH3 expression were not included in the CATH3 graph.

