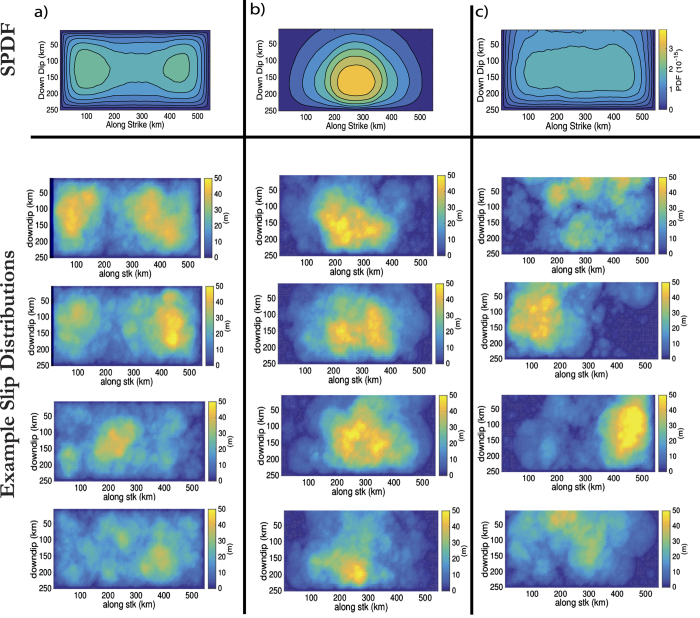
Figure 1. Systematic slip probability density function based on different methods of distributing slip on a 520 km by 250 km fault.
The x-axis is along fault strike, the y-axis is along dip with the fault surface along the top of the subfigures. 500 simulations were used to produce the SPDF in each subfigure. (a) Using a uniform PDF for the spatial distribution of slip with a boundary taper; (b) a stationary Gaussian function is used as the PDF, the slip taper along the surface has been removed (c) best attempt at producing uniform SPDF that extends to the free surface. Some examples of the slip distributions used to make each of SPDFs are provided below the SPDFs.

