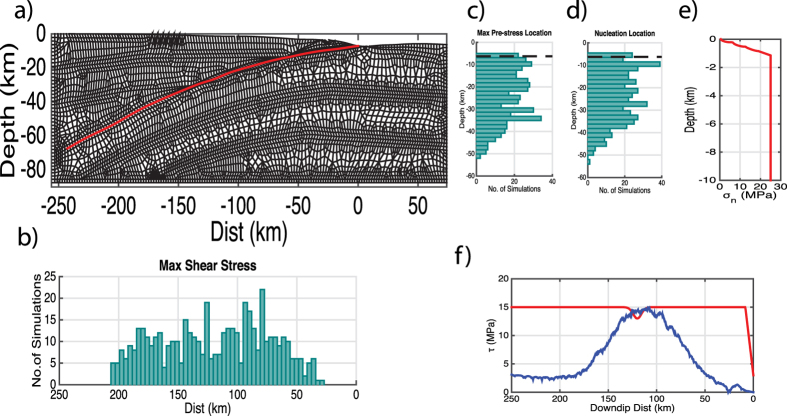
Figure 2.
(a) Fault geometry for dynamic simulations and numerical mesh used for the simulations; the red line defines the fault; (b,c) are histograms of the location of maximum pre-stress for the ensemble of simulations; (d) is the histogram of nucleation locations with depth for the ensemble simulations; in subplots c) and d) the dashed black line is the edge of the wedge. (e) is the variation of the normal stress with depth which has been reset to 0.5 MPa at the point where the fault reaches the surface giving it a different datum than subplot a). (f) is an example of one initial stress distribution (in blue) and the yield stress (solid red line). The nucleation patch is at 120 km down dip where the yield stress drops smoothly by amplitude of 2 MPa.

