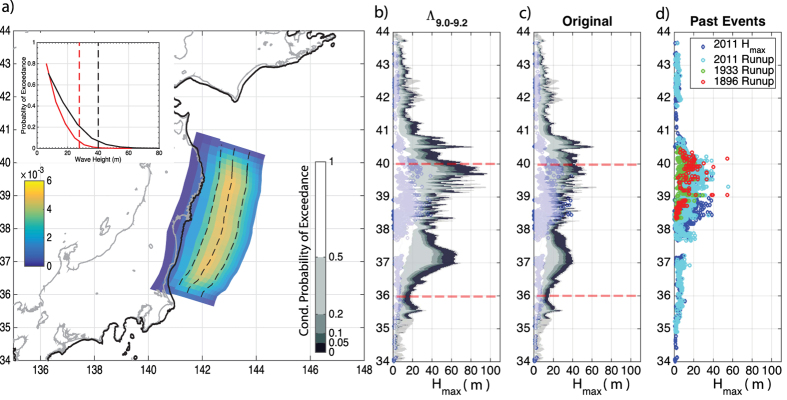
Figure 7.
(a) Location of the fault (the subduction zone interface) relative to the Japanese coastline and receiver locations (denoted by black dots). Colours on the fault plane are the SPDF for the modified stochastic source model. Dashed lines across the fault plane mark 50 km, 100 km, 150 km down dip distance from the top of the fault. Bold black line denotes tsunami receiver locations (see Methods). Inset figure is the probability of exceedance for a wave height between 36° and 40° latitude based on the original (red line) and modified (black line) stochastic models this range was taken due to the limited nature of the fault plane considered which is a section of a larger subduction zone the limits of which are denoted in subplots b and c by red dashed lines. (b) Conditional probability of exceedance of maximum wave height along latitude, for the modified source model for a M 9 event; and (c) original stochastic source model, again for a M 9 earthquake. The logarithmic colour scale is the same for both plots. The grey solid lines indicate the maximum and minimum Hmax obtained at each receiver. Blue diamonds are maximum tsunami wave height observed during the 2011 Mw 9 earthquake51, as in panel d. (d) observed maximum wave height and runup for 2011 Mw 9 Tohoku earthquake51. the 1896 Ms 7.2 and 1933 Ms 8.5 Sanriku earthquakes52. Coastline data from GSHHG database (https://www.ngdc.noaa.gov/mgg/shorelines/gshhs.html).

