Figure 2.

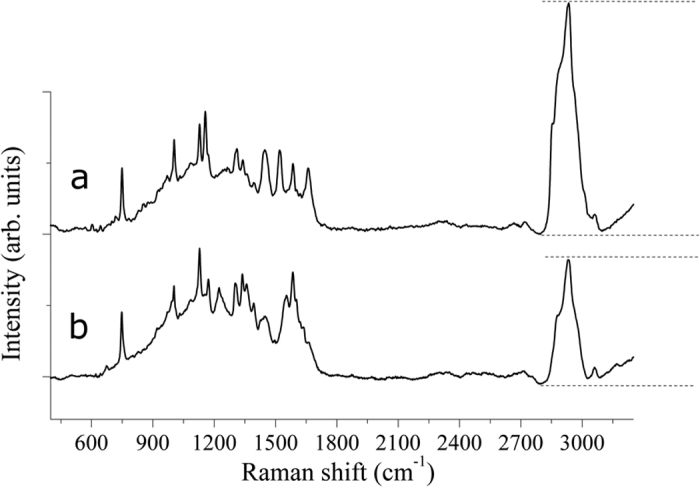
Full range Raman spectra collected upon (a) PTC and (b) healthy tissues. The shown spectra are average from the complete corresponding dataset.

Full range Raman spectra collected upon (a) PTC and (b) healthy tissues. The shown spectra are average from the complete corresponding dataset.