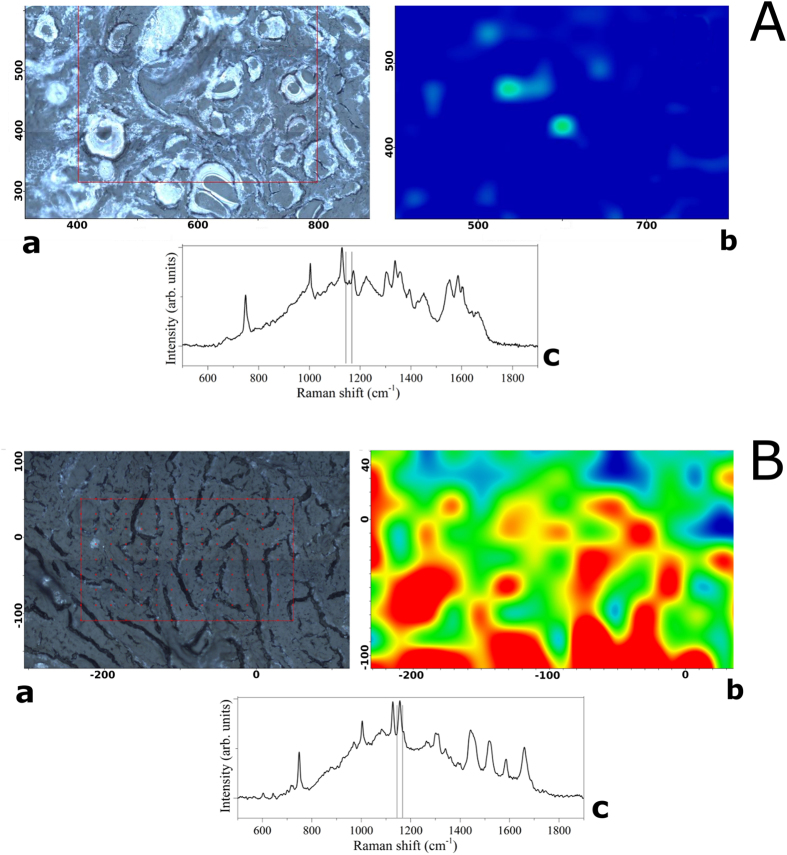
Figure 3.
Typical example of Raman chemigram maps (1156 cm−1 band reference) for thyroid tissues: (A) healthy tissue ((a)–dark field optical image, (b)–Raman map, (c)–average reference Raman spectrum), (B) PTC tissue ((a)–dark field optical image, (b)–Raman map, (c)–average reference Raman spectrum). The red square on the right side (a) corresponds to the investigated tissue area shown on the left (b). The scale bars are expressed in μm.

