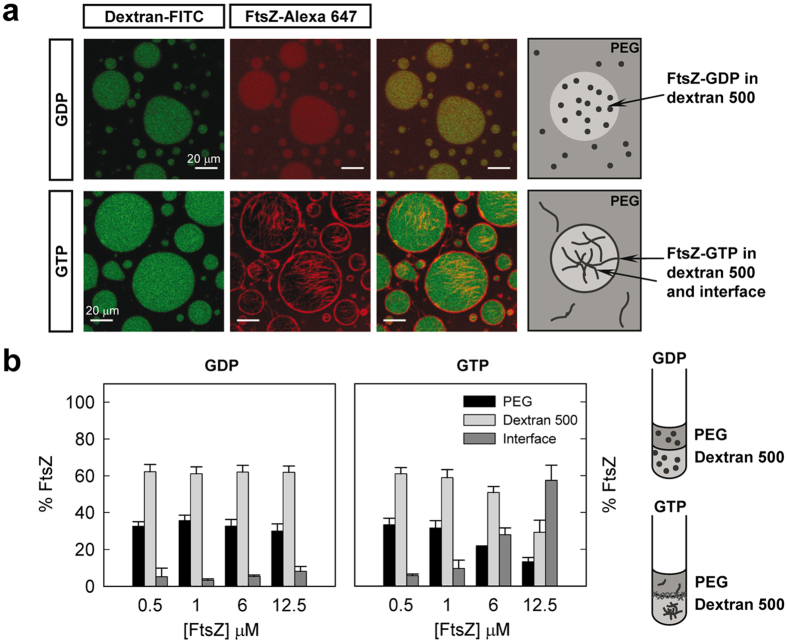
Figure 2. Distribution of FtsZ in the PEG/dextran 500 LLPS system.
(a) Representative confocal images of FtsZ within the PEG/dextran 500 (3:1) emulsions in the absence and presence of 1 mM GTP. Total FtsZ concentration was 7 μM. A schematic illustration of the disposition of FtsZ within the phases is depicted on the right. (b) Concentration dependence of the distribution of FtsZ within the mixture as determined by fluorescence, together with an illustration on the right, in the absence and presence of 1 mM GTP. Data are the average of at least 3 independent measurements ± SD.

