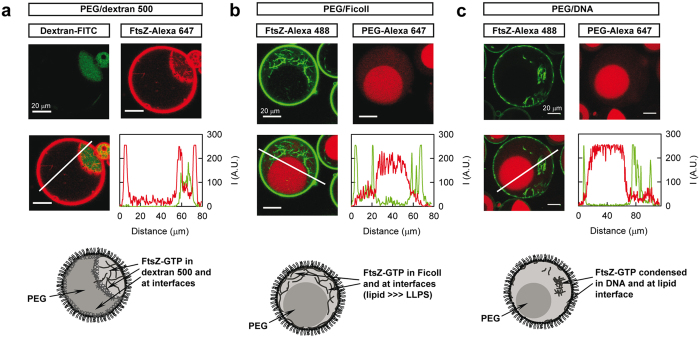
Figure 6. Distribution of FtsZ polymers in several binary mixtures encircled by a lipid layer.
(a) PEG/dextran 500 (3:1), total FtsZ concentration 7 μM. (b) PEG/Ficoll (1:1), total FtsZ concentration 6 μM. (c) PEG/DNA (1:1), total FtsZ concentration 12 μM. In all the images of the superimposed channels, lines depict the region through which the intensity profiles for each individual channel (red curve for Alexa 647, green curve for FITC or Alexa 488) were obtained. 1 mM GTP. Cartoons represent the distribution of FtsZ within the encircled phases.

