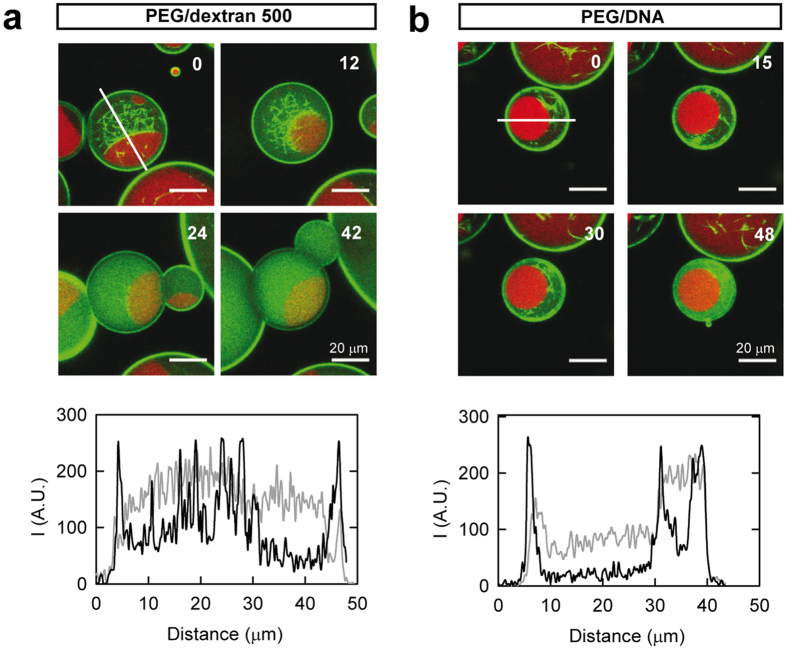
Figure 7. Dynamic behaviour of FtsZ polymers within LLPS systems inside lipid containers.
(a) PEG/dextran 500 (3:1), total FtsZ concentration 6 μM. Monitoring of depolymerization started 14 min after GTP addition. (b) PEG/DNA (1:1), total FtsZ concentration 12 μM. Monitoring of depolymerization started ∼2 h 20 min after GTP addition. In all panels, distribution of FtsZ at the specified time in minutes, time zero being the beginning of visualisation. 0.75 mM GTP. Fluorescence signals correspond to PEG-Alexa 647 (red) and FtsZ-Alexa 488 (green). Lines indicate the region, adapted in each image depending on the orientation of the droplet, through which the intensity profiles below depicting the distribution of FtsZ were obtained (black and grey, zero and end times, respectively). Random variations of the profiles due to subtle movements on the droplet during visualisation were corrected by matching maxima corresponding to the lipid boundary along the x axis.

