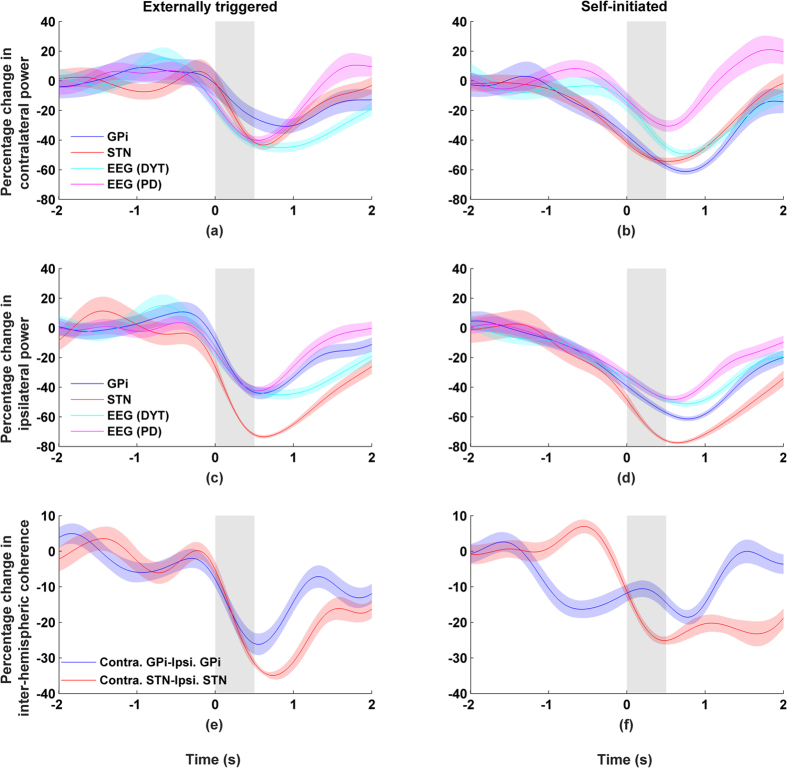
Figure 5. Activity from STN and GPi recorded from both the ipsilateral and the contralateral sides.
Movement duration indicated by grey background and shaded areas indicate standard errors. Left column shows externally triggered task; right column self-initiated task. Percentage changes in alpha band (8–12 Hz) showing (a–d) power and (e/f) inter-hemispheric coherence between left-right GPi or left-right STN.

